

Key Takeaways
Carrier Coverage Map
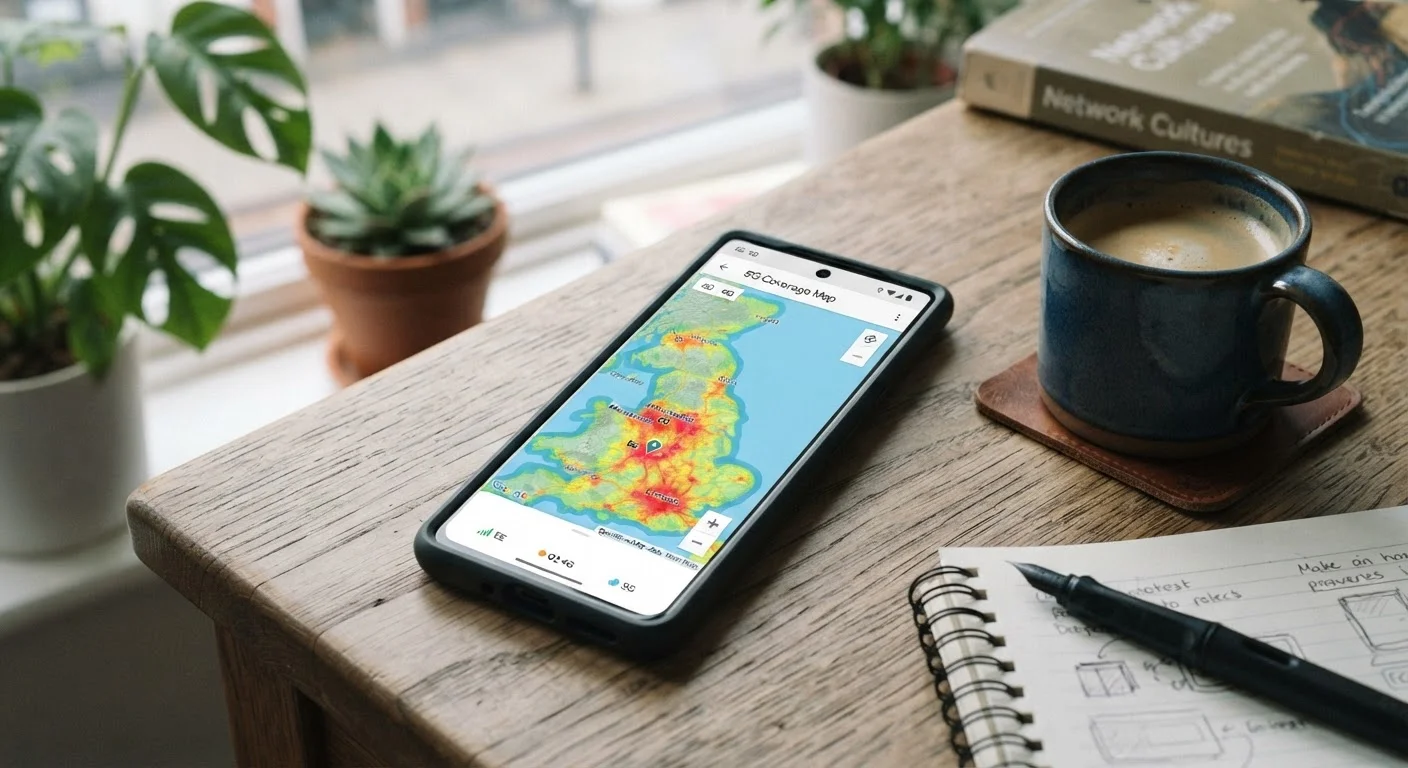
A coverage map is a visual tool published by a wireless carrier that shows, using colored shading, the geographic areas where its network is expected to provide service. Darker or more saturated colors typically indicate stronger predicted signal. These maps are generated from a combination of tower data, terrain modeling, and propagation algorithms - not from direct real-world measurements at every location.
Coverage predictions use radio-frequency propagation models that account for tower placement and general terrain, but cannot account for individual building materials, foliage density, or localized interference that affect actual signal reception.
How Coverage Maps Are Built
When a carrier publishes a coverage map, it is not sending engineers to test signal at every street corner. Instead, the map is generated by software that combines known tower locations, antenna angles and power levels, and terrain elevation data to predict where radio signals should reach. The result is an estimate - one that can be reasonably accurate in open, flat terrain but increasingly unreliable in dense urban environments or mountainous regions.
Carriers also have an inherent incentive to present their coverage favorably. The shading on a map often represents the outer edge of where a signal could reach under ideal conditions, not where a user reliably will receive a usable connection. This distinction matters enormously in practice.
Coverage Maps Are Estimates, Not Guarantees
No wireless carrier guarantees service based on its coverage map. Maps are planning and marketing tools built on predictive models. Actual signal at any specific location depends on factors no model can fully anticipate, including building construction, local interference, and network load at a given moment.
For a broader look at how wireless plan structures can affect your overall experience, see our guide on wireless plan pricing - coverage is just one piece of the puzzle.
The Gap Between the Map and Reality
Even in an area shaded as fully covered, several real-world factors can reduce or eliminate usable signal:
- Building materials: Concrete, metal framing, and energy-efficient low-emissivity glass are all effective at blocking radio waves. A location with excellent outdoor coverage may have poor indoor reception.
- Terrain and foliage: Hills, valleys, and dense tree cover absorb and reflect signals in ways that propagation models approximate but cannot fully predict.
- Network congestion: Even strong signal does not guarantee fast data speeds. A tower serving a packed sports stadium or a busy highway corridor may deliver slow throughput despite full bars.
- Frequency band: High-band 5G (millimeter wave) offers very high speeds but travels short distances and cannot penetrate most walls. Mid-band and low-band signals cover far more area but are often shown on the same map with identical shading, making them visually indistinguishable.
~83%
U.S. geographic area with some LTE coverage
FCC data indicates the vast majority of U.S. geography has some form of LTE coverage, but population density means coverage quality varies sharply between rural and urban areas.
30-40%
Signal loss typical indoors vs. outdoors
Industry radio-frequency engineering estimates commonly cite 10-40 dB of building penetration loss depending on construction materials, translating to noticeably weaker indoor signal even in well-covered areas.
3
Main 5G spectrum bands with very different range profiles
Low-band, mid-band, and high-band (mmWave) 5G offer dramatically different coverage footprints and speeds, yet are often shown with identical shading on consumer-facing coverage maps.
Understanding these limitations is especially relevant when evaluating home internet service. The U.S. home internet market guide explains how fixed wireless and mobile broadband services carry similar coverage caveats.
How to Evaluate Coverage Before You Commit
Rather than relying solely on a carrier's published map, experienced consumers use several complementary strategies to assess real-world coverage:
- Use the FCC's Broadband Map as a cross-reference. While it has its own limitations, it aggregates data from multiple sources and provides an independent perspective on coverage claims.
- Request a trial period. Several carriers offer eSIM-based trials or short-term test plans that allow you to use their network on your current device before switching. This is the most direct way to assess coverage at your home, workplace, and frequently traveled routes.
- Crowdsourced signal data. Third-party tools aggregate real signal reports from actual users in your area, giving you a ground-level picture that complements the carrier's own map.
- Ask locally. Neighbors, coworkers, and local community groups often provide honest, experience-based assessments of which carriers perform well in a specific area.
Coverage quality is closely related to the plan type you select. Unlimited data plans vary widely in how they handle congestion and deprioritization - issues that compound poor coverage in high-demand areas.
“A coverage map tells you where a carrier has built infrastructure. It does not tell you whether that infrastructure will serve you well inside your home, in your office, or on your commute. Those are real-world questions that require real-world testing.”
— FCC Consumer Advisory Panel, Advisory body on consumer telecommunications standards
Coverage Maps as One Tool Among Many
Coverage maps are a reasonable starting point for narrowing down your carrier options, particularly when evaluating service in rural or less-populated areas where network reach genuinely differs between carriers. But they should never be the final word. Treating a coverage map as a guarantee - rather than a prediction - is one of the most common and costly mistakes consumers make when selecting a wireless plan.
The safest approach is to layer multiple sources of information: the carrier's map, independent coverage tools, local word-of-mouth, and whenever possible, a direct hands-on trial. That combination gives you a far more accurate picture than any single source can provide on its own. For context on how coverage intersects with other plan features, explore our Home Internet hub for deeper guidance on service types and what to look for.